The international credit crisis was not predicted by the world’s leading financial analysts because they relied on models based on historical statistical data that could not adapt to new circumstances even when those circumstances (in this case the collapse of the mortgage sub-prime market) were foreseeable by experts with more intimate knowledge of the market place. The challenges are similarly acute when the source of the risk is novel and complex (multiple interrelated causes).
Even though we may have little or no historical data, there is often an abundance of expert (but subjective) judgement, as well as diverse information and data on indirectly related risks. These are the types of situation that can be successfully addressed using Bayesian Networks (BNs), even when data-driven approaches to risk assessment are not possible. BNs describe 'webs' of causes and effects (causal chains) using a graphical framework that provides for the rigorous quantification of risks.
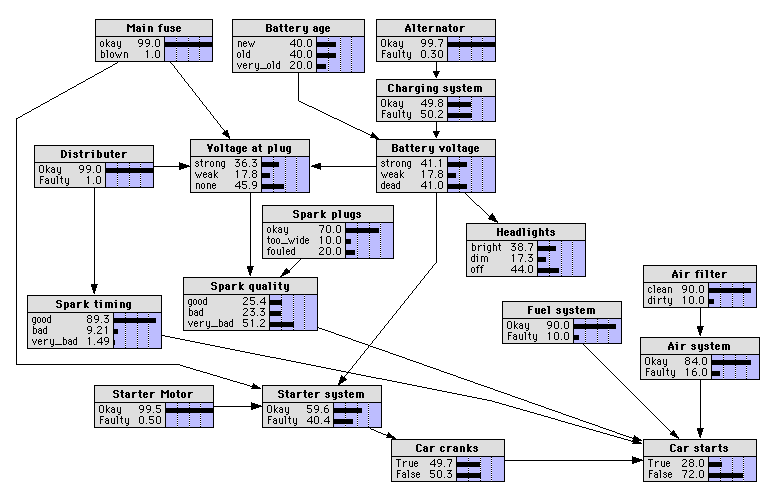
The figure below is a 'simple' (!) example ('car won't start'); the ‘nodes’ of a BN represent variables while the ‘links’ represent causal or influential relationships.

Bayesian calculations are very complex but have become very popular over the last decades as a result of computing power.
In the next two web lecturers we will:
- First have a closer look at a causal analysis with flooding as running example;
- And then explain the 'logic' (including formulas) for developing BN (with again flooding as our running example).
FOR STUDENTS
Would like to know a lot more and practise BN yourself? Then we suggest:
-
the book: Risk Assessment and Decision Analysis with Bayesian Networks
-
to read this document (example of the power and actual use of BN) : Causal Model for Air Transport Safety
-
to download (partly for free) Netica software: https://www.norsys.com/download.html

